The correction of several euro area countries’ external imbalances began almost 10 years ago. A number of euro area countries ran massive current account deficits in 2007/8. With 15.2% of GDP, Greece had the largest deficit, followed by Portugal with a deficit of 12.1%, Spain of 9.6% and Ireland at 6.9%. Those deficits were not only large but had been large for a number of years leading to a significant build-up of external liabilities. As funding dried-up, deficits came down.
A popular myth of the history of the euro area is that the correction of these external deficits became a process predominantly driven by falls in imports, while exports hardly moved. Accordingly, so the myth goes, domestic consumption and production fell dramatically while there was no offsetting increase in exports that would have helped dampen the fall in production and employment. After ten years, it is time to revisit this myth and tell the story of how economies adjusted and boosted exports.
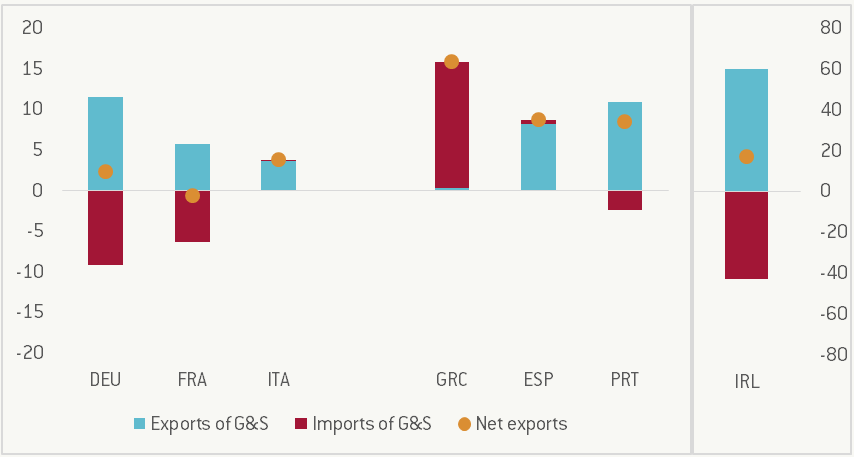
If we consider the time period 2007 –2016 (see Figure 1), one can see that in this 10 year period, in most countries the adjustment happened through exports, while imports remained flat or increased more slowly. In Spain and Portugal, the trade balance adjusted by about 8.5 percentage points (pp.) of GDP, with the contribution of exports being 8 and 11 pp. and that of imports 0.5 and -2.5 (i.e. imports increased) respectively. In Ireland too, the improvement of the trade balance was the result of an increase in both exports (60 pp.) and imports (43 pp.), with the former outpacing the latter. However, a major revision of Irish national account statistics that took place in 2015 and impacted mainly exports of goods and imports of services is at least partly responsible for these large changes (http://ec.europa.eu/eurostat/documents/24987/6390465/Irish_GDP_communication.pdf).
There is, however, one major exception: Greece. Essentially all of the adjustment of this major deficit happened through a massive contraction in imports, while the export sector played virtually no role in adjustment.
Figure 1: Adjustment of the trade balance: import or export driven
 Source: AMECO
Of course, one has to ask what a good benchmark is. One cannot take pre-crisis import growth, which was certainly too large and driven by unsustainable capital inflows. For reasons of completeness, we also show Germany, France and Italy for the same period. However, all three countries were following different dynamics in the concerned years. Of course, the German data confirm the well-known and worrying fact that in Germany, exports were growing more strongly than imports thus driving up the trade balance even further. As a consequence, there was no adjustment in Germany.
The new data confirm and strengthen the overall picture of a previous blog post from 2013: external trade balance adjustment in the major current account deficit countries of the euro area was driven by increases in exports and flat or slowly increasing imports. The exception is Greece, whose external adjustment does not fit into that story. The Greek story certainly underlines the importance of firms that can operate and compete in global markets and increase their production destined for export when domestic demand is weak. Most euro area periphery countries therefore had the capacity to partially compensate the shortfall in domestic demand by re-directing production towards exports. This can be qualified as a success in adjusting to the decline in domestic demand that followed the previous excess borrowing.
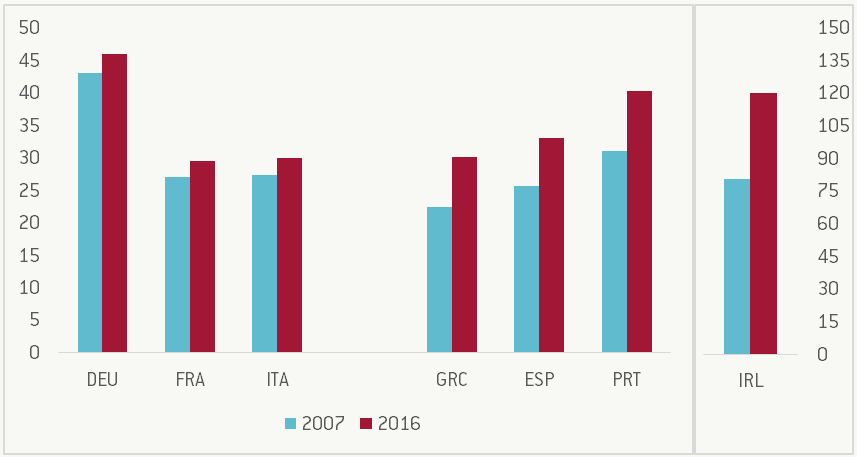
Another way to see the contribution of exports is to assess their relative importance in the economy. Figure 2 shows the share of exports in nominal GDP both in 2007 and 2016. Whereas countries like Germany, France and Italy saw their exports only increase slightly in terms of GDP, to the tune of 2.5-3 pp., all programme countries now boast substantially higher export to GDP ratios (+7 pp. in Spain, +9 pp. in Portugal, +7.5 in Greece; with the caveat above in mind, +40pp. in Ireland).
Figure 2: Exports of goods and services as a share (%) of GDP
 Source: AMECO
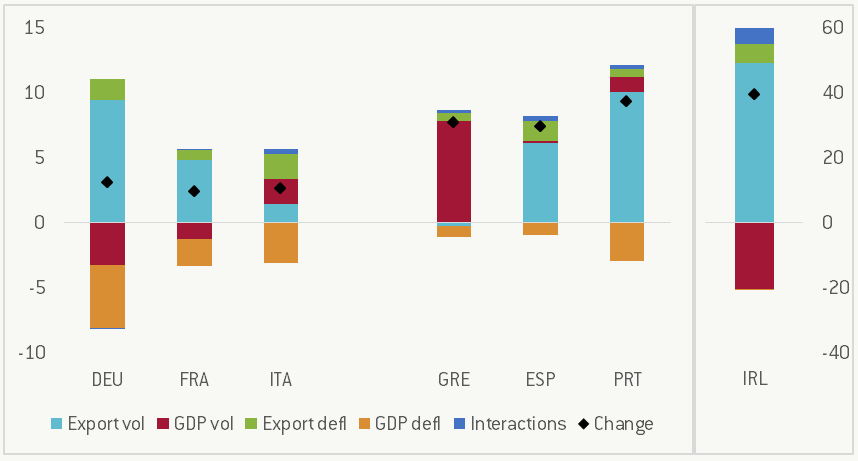
But do export-to-GDP shares tell the whole story? After all, programme countries underwent severe recessions during the same period: sizable falls in the denominator (GDP) can mimic the effect of increased openness and export competitiveness. Moreover, both exports and GDP are measured in nominal terms and, thus, include the effects of changes in prices. Again, the value of exports may go up even if the same amount of goods and services is purchased if prices increase; the same goes for GDP. Therefore, a more nuanced approach calls for disentangling these various impacts. Figure 3 decomposes the change in the export-to-GDP share into five constituent components. The first four capture the contribution of volume and inflation of both exports and GDP. The fifth, smaller term encompasses interactions between the growth rates. The main point raised above remains relevant: for Spain, Portugal and Ireland most of the increase in the share of exports is indeed explained by higher export volume. Only in Greece almost the entirety of the rise in the export share is accounted for by falling real GDP.
Figure 3: Contributions to the change in the export-to-GDP ratio (%), 2007-16
 Source: AMECO; own calculations
