The President of the European Commission is worried about the investment situation in Europe and has taken the initiative to propose a €300 billion investment plan to the December European Council meeting.
Under the leadership of Vice President Katainen, the Commission has designed a plan which will be announced this week. The announcement of the investment plan is scheduled to coincide with the announcement by the Commission of its assessment of national budgetary plans for 2015. The hope is that the investment package will be significant enough to boost growth and make it possible for EU countries to comply with EU fiscal rules in the years to come. As we argued some time ago “without growth, it will become impossible to respect the spirit of the fiscal rules”.
Before evaluating whether the investment plan is sufficient to boost growth, there is a need to evaluate the extent of Europe’s investment problem, which is what this blog post does.
Our starting point is a long-term view of investment growth in Europe. Chart 1 shows the development of investment measured in 2014 prices in the “old” EU15 (for which data is available for a much longer period that for the current EU28) from 1970 to 2014. We compute a simple linear trend from 1970 to 2005, in order to take out the years of the construction boom that affected some EU countries in 2006 and 2007 and document the deviation of investment from this trend. A linear trend captures the overall development of investment quite well as the graph shows. Investment is currently €260 billion below this trend suggesting that the EU suffers indeed from a substantial shortfall in investment.
Chart 2 shows the comparable graph for investment excluding construction (i.e. dwellings, non-residential construction and civil engineering projects). The investment gap for non-construction investment is still substantial at €160 billion.

Bruegel Calculations based on AMECO. Note: the gap is defined as linear trend in EUR billion in 2014 minus real investment in EUR billion in 2014

Bruegel Calculations based on AMECO. Note: the gap is defined as linear trend in EUR billion in 2014 minus real investment in EUR billion in 2014.
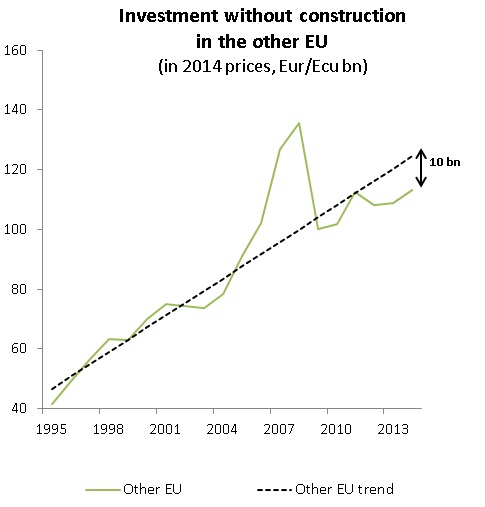
Turning to the Member states that have joined the EU since 2004, the data is only available since 1995 therefore we compute a linear trend for the shorter period of 1995-2005. Obviously, one can hardly compare the EU15 with these countries since the latter grouping experienced significant catching-up growth and very substantial capital inflows from Western Europe even before they joined the EU. As shown in Charts 3 and 4, the gap is €20 billion for total investment and €10 billion for non-construction investment.

Bruegel Calculations based on AMECO. Note: “other EU” encompasses 11 member states (CY, CZ, EE, HU, LV, LT, PL, SK, SI, BU, RO), the EU27 deflator was used for the other EU aggregate; the gap is defined as linear trend in EUR billion in 2014 minus real investment in EUR billion in 2014.
Bruegel Calculations based on AMECO. Note: see chart 3.
Another important question is to what extent public investment has played a role in mitigating the fall in total investment.
Chart 5 shows the development of public investment during 1970-2014 and the deviation from trend. We find that in the EA12, public investment rose substantially above the 1970-2005 trend in 2009 but then fell sharply, giving rise to current shortage of €25 billion. There is currently no shortfall for the EU15 but a similar sharp decline in public investment occurred after the 2009 stimulus. Obviously simply being on the same trend as during the relatively mild 1970-2005 implies that public investment is not playing its role in mitigating Europe’s investment problem.
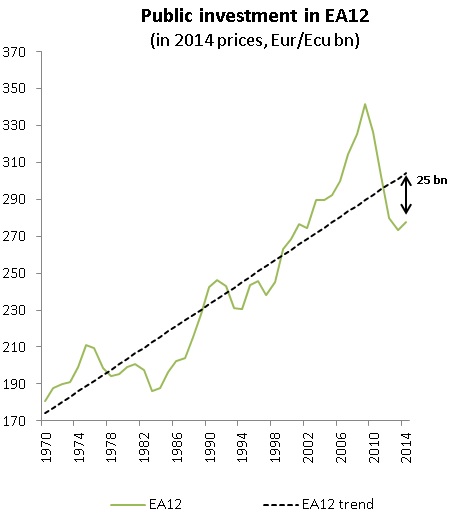
Source: Bruegel Calculations based on AMECO. Note: “EU12” excludes AT and LUX from 1970-95 due to missing data; the gap is defined as linear trend in EUR billion in 2014 minus real investment in EUR billion in 2014.
We next turn to the five largest EU countries, Germany, France, UK, Italy and Spain and zoom in on how investment developed in construction and non-construction during the crisis period from 2007 to 2014. A number of substantial differences emerge in the 5 countries with trends in some of them being particularly worrisome. Chart 6 shows indeed different patterns across the five countries:The total investment free fall observed in Spain since the beginning of the crisis has been mainly driven by the correction of overinvestment and misallocation of capital in the construction sector that characterized the pre-crisis period. A look at the non-construction investment reveals however that it has rebounded strongly since the low point of 2009.
The decline in investment in France has been relatively modest initially and has recovered relatively quickly from the 2009 recession, but has been basically stagnating ever since and is now around the level of 2010.
Germany exhibited a stronger drop in investment in 2009 and a quicker recovery in 2010, followed by an overall modest growth (which was fueled, in contrast to the other countries, by strong growth in the construction sector).
Investment in the UK has been sluggish since it reached a low point of 2009-10 and has stayed around this level thanks to investment in construction.
Finally, Italy offers the most worrying picture with a continuous and broad-based decline in investment since the beginning of the crisis.

Source: Bruegel based on Eurostat. Note: the data for the United Kingdom is a 4 period moving average. The same deflator has been used for total investment and its components and the latest data available is 2014Q2.
In this post, we have documented a substantial decline in investment, both private and public as well as construction and non-construction throughout the EU.
The numbers show that the EU is substantially below long-term trends. Given the central importance of investment for growth in the short but also in the long term, this is a very worrying development.
We urge the European Commission to present an ambitious plan to re-invigorate growth and jobs in the EU. Failure to do so would result in continued stagnation of the EU economy in the years to come.

